
An inverted yield curve is often seen as a signal of a looming recession. This just happened in August 2019.
Many people are asking if this inverted yield curve means investors are headed for a recession.
In this post I’m going to breakdown very simply what an inverted yield curve is, and what it means for investors.
An Inverted Yield Curve in Plain English
We hear about the stock market every day. The S&P 500 is up 0.6%, the Dow Jones is down 400 points…it never stops. Think about the stock market as a device which tells exciting short stories about companies. When a stock price goes up, investors view the company positively. The inverse is true when a stock price goes down.
Day-to-day, nobody knows exactly why stock prices behave the way they do; it’s rarely due to just one thing.
So, if the stock market tells short stories, think of the bond market as a boring novel. Most people are interested in stocks but largely ignore bonds.
The bond market is larger and contains a lot of information. In fact, in 2017 the global equity market had a market capitalization of $85.3 trillion while the bond market was $100.1 trillion.
So, when news breaks that the bond market, in the most reliable government in the world is out of whack, it can be concerning.
Here’s a simple example to explain what occurred:
Imagine a world where you give me $100 for a period of two years. In return, I promise to pay interest of $5 a year with $100 paid back in year two. Not a bad deal.
Now imagine you give me $100 for a period of ten years. In return, I promise to pay interest of $3 a year with $100 paid back in year ten. This deal isn’t as good.
This is essentially what happens when the curve inverts: the yield of long-term bonds fall below short-term bonds. This isn’t good, since you should be rewarded for lending your money over a long period of time by receiving higher interest payments.
A yield curve inversion has preceded a recession many times since 1950. Most recently, it occurred in August 2019 causing recessionary fears to heat up. However, there are a a few things to note:
- There are two instances in which a yield curve inversion did not precede a recession
- The length and severity of an inversion may have an impact on the outcome
- The recent inversion may be distorted by an influx of investors buying US bonds
In short, there’s no need to panic. If you are panicking, it’s time to evaluate your financial plan and risk tolerance. It’s better to have a good investment plan you can stick to than a great investment plan you’re constantly changing.
For a deeper understanding, let’s continue.
Understanding the Yield Curve
Critical to understanding the yield curve is bond maturity. A bond’s maturity determines when a bond will be repaid to an investor. For example, a 10-year bond will mature in 10 years; meaning the holder will receive the bond principal at that time.
A bond yield is simply the interest payment paid by the bond divided by the price.
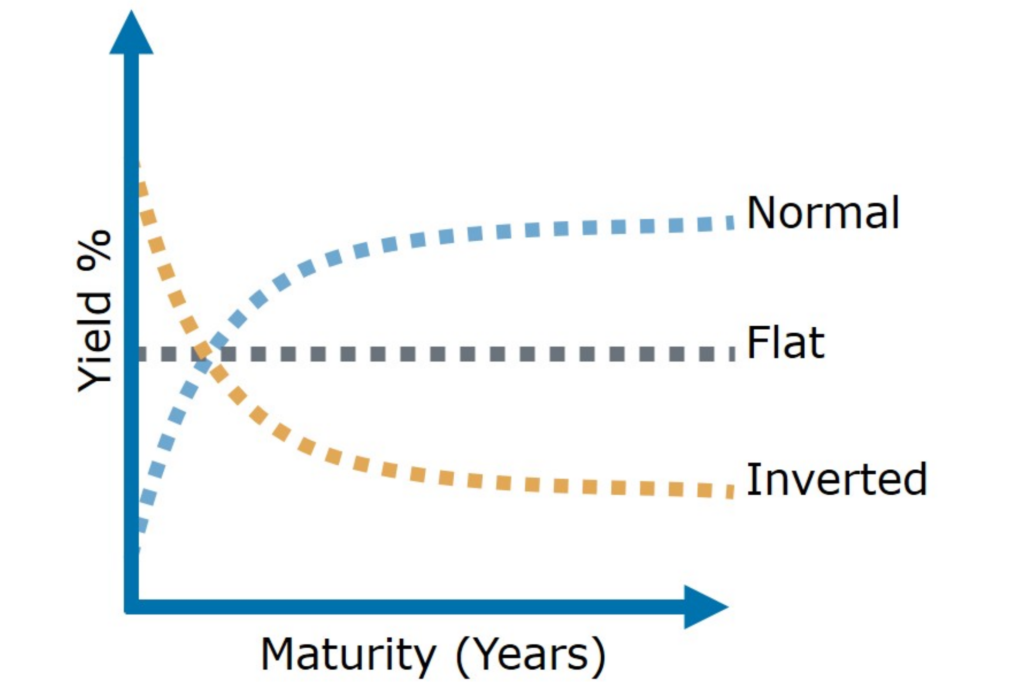
A yield curve plots the relationship between bonds of different maturities and their corresponding yields, commonly 10-year and 2-year treasury bonds.
A normal yield curve has a smooth slope upwards. Bonds with shorter term maturities have lower yields than bonds with longer maturities. This makes sense, because under normal conditions, an investor should be rewarded for holding bonds with a longer maturity.
During a yield curve inversion, the chart begins to slope downwards. This is troubling, as bonds with shorter maturities are paying higher yields than bonds with longer maturities.
Possible Causes of an Inverted Yield Curve
There can be many reasons for an inverted yield curve. Before we discuss a current theory, it’s important to understand two things: how supply and demand impacts price and how the price of a bond impacts the yield.
When treasury bonds are issued, they come with a fixed interest rate. The price of the bond after issue, however, is not fixed and is determined by the market. As demand increases, the price of a bond goes up. When the price of a bond goes up, the yield decreases.
Therefore, when the yields of long-term bonds decrease it flattens the yield curve, and if severe enough, can result in an inversion.
The most common theory for why the yield curve inverted in August 2019 is due to distortion. This distortion has been caused by more than $15 trillion worth of foreign bonds paying negative interest rates.
The US has the safest and best-paying bonds in the world right now, so investors are taking their money out of negative interest rate environments and buying US bonds that have a positive return.
This means demand is increasing, resulting in higher bond prices, leading to lower yields, resulting in a flattening and inverted curve.
Implications of an Inverted Yield Curve
The simple implication of an inversion is if smart investors see more risk ahead in the next two years than 10 years down the road, it’s not good for short-term growth.
A yield curve inversion is also terrible for banks. This is because banks generate a majority of their revenue from the spread of their funding cost and return on lending.
When the curve is normal, banks have an incentive to borrow short-term loans at lower rates and lend long-term loans (think mortgages) at higher rates.
When the curve is inverted, short-term lending becomes more expensive than long-term lending. This results in lower profitability, and when lending becomes less profitable for banks, they tend to pull back. This is often accomplished by tightening lending standards.
With a reduced velocity of lending, the economy can slow down.
What Does this Mean for Investors?
The historical average time between an inversion and possible recession is typically 11 months according JP Morgan Asset Management.
But it’s important to remember that an inverted curve has occurred in the past without resulting in a recession. This happened twice: once in 1965 and another in 1998. It’s possible this could just be another case of a false positive.
An inverted yield curve preceding a recession may also depend on the length and severity. In August 2019 the inversion was brief, short, and lasted less than a day.

Using an inverted yield curve to predict a recession is dangerous. We need to be careful extrapolating upon past data and circumstances to infer the future.
Advisors analyze investments using backtests, which assesses how certain investments would have performed in past conditions. It provides context but does not predict the future. It is why good advisors remind clients that past performance is not a guarantee of future results.
In fact, in reference to a Fama/French paper entitled “Inverted Yield Curve and Expected Stock Returns” Ben Carlson writes, “The duo’s conclusion states that, “We find no evidence that inverted yield curves predict stocks will underperform Treasury bills for forecast periods of one, two, three, and five years.” They compared three broad market indexes, using the U.S. stock market, the World stock market, and the World ex-U.S. stock market. The switching strategy of going from stocks to cash underperformed a long-only buy and hold strategy in all 24 instances using the U.S. and World markets. The yield curve signal also underperformed in 19 of 24 World ex-U.S. backtests.”
Going forward, I think investors who have a financial plan in place and a disciplined investment strategy will weather the potential storm, should that be 3 months or 3 years from now.
As history has shown, those who try and time the market by getting in and out lose money in the long run. It will also be interesting to see if investor awareness of the signal could alter its usefulness going forward.